4513.0 - Criminal Courts, Australia, 2016-17  Quality Declaration
Quality Declaration ARCHIVED ISSUE Released at 11:30 AM (CANBERRA TIME) 28/02/2018
Page tools:
 Print Page Print Page
 Print All Print All
| ||
INDIGENOUS STATUS This chapter presents Indigenous status data about defendants finalised in the criminal courts of New South Wales, Queensland, South Australia and the Northern Territory. Data for other states and territories are not of sufficient quality and/or did not meet ABS standards for self-identification for national reporting in 2016–17. Defendants with a principal offence of Traffic and vehicle regulatory offences, or Dangerous and negligent driving offences have been excluded from Indigenous status data presented in this publication. For more information see Explanatory Notes paragraphs 60–63. Defendants who self-identified as Aboriginal and Torres Strait Islander will be referred to as Aboriginal and Torres Strait Islander defendants within this chapter. ABORIGINAL AND TORRES STRAIT ISLANDER DEFENDANTS Across the selected states and territories in 2016–17, Aboriginal and Torres Strait Islander defendants comprised:
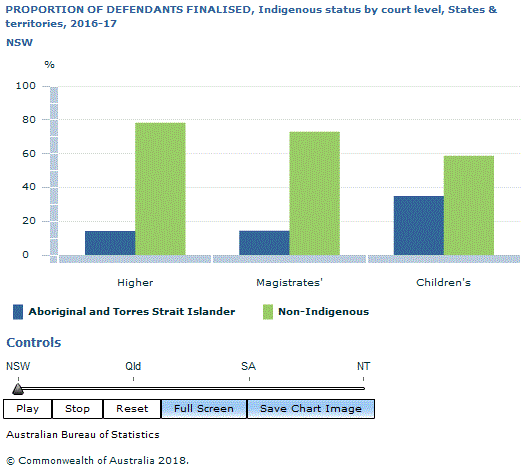
The Children’s Courts had the highest proportion of Aboriginal and Torres Strait Islander defendants compared to the other court levels. In 2016–17, the proportion of defendants who identified as Aboriginal and Torres Strait Islander within the Children’s Courts was:
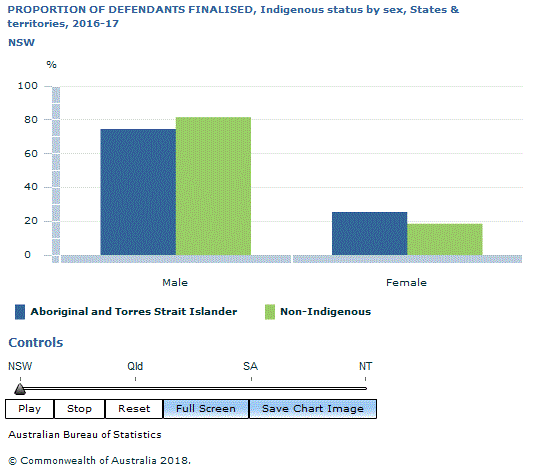
 Source(s): Criminal Courts, Australia SEX There was a higher representation of females amongst the Aboriginal and Torres Strait Islander defendant population, when compared to the non-Indigenous population.
 Source(s): Criminal Courts, Australia PRINCIPAL OFFENCE In 2016–17, Acts intended to cause injury was the most common principal offence amongst Aboriginal and Torres Strait Islander defendants in:
In Queensland, Public order offences were the most common (23% or 5,489 Aboriginal and Torres Strait Islander defendants). (Table 12) In New South Wales and South Australia, Acts intended to cause injury was also the most common offence amongst non-Indigenous defendants (34% or 22,464 and 23% or 4,661). The most common principal offence for non-Indigenous defendants finalised in Queensland and the Northern Territory was Illicit drug offences (26% or 20,824 and 28% or 434 respectively). (Table 12) 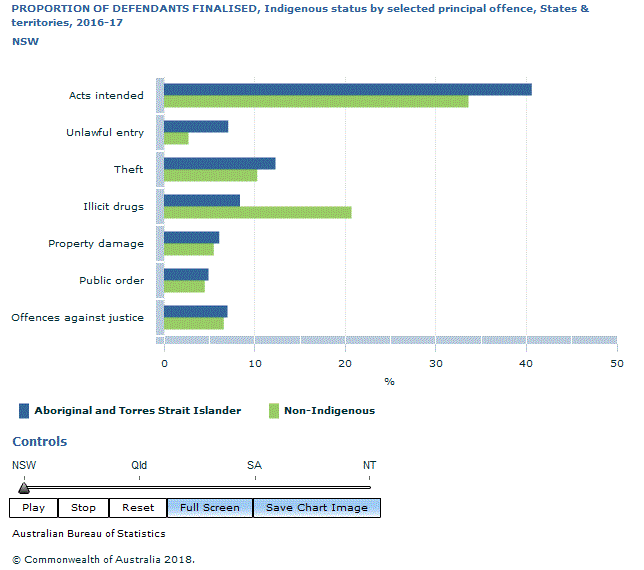 Source(s): Criminal Courts, Australia METHOD OF FINALISATION In 2016–17, the proportion of defendants who were proven guilty was slightly higher amongst Aboriginal and Torres Strait Islander defendants compared to non-Indigenous defendants except in New South Wales. The difference was greatest in South Australia where 69% of Aboriginal and Torres Strait Islander defendants were proven guilty, compared with 62% of non-Indigenous defendants. (Table 12) 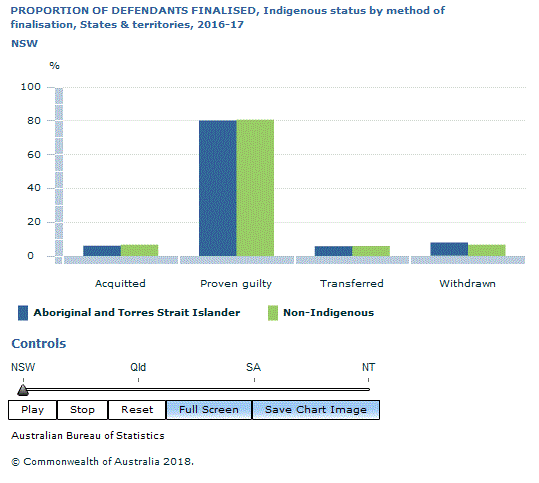 Source(s): Criminal Courts, Australia PRINCIPAL SENTENCE In 2016–17, the proportion of defendants who were sentenced to custody in a correctional institution was greater amongst defendants who identified as Aboriginal and Torres Strait Islander when compared to non-Indigenous defendants across all selected states and territories. In the Northern Territory three in five (59% or 2,918) Aboriginal and Torres Strait Islander defendants who were proven guilty were sentenced to custody in a correctional institution, compared to 34% (407) of non-Indigenous defendants. (Table 12) 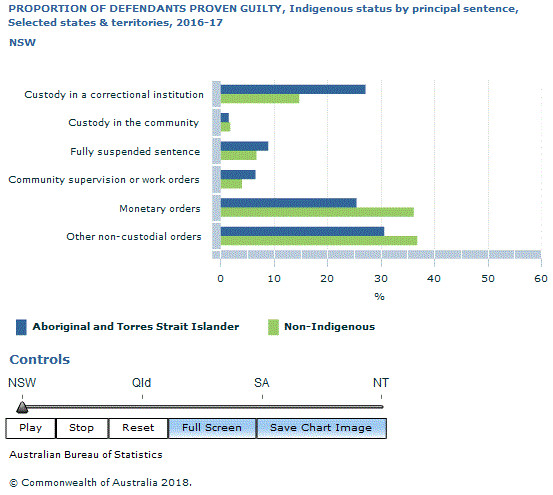 Source(s): Criminal Courts, Australia SENTENCE LENGTH The median sentence length for custody in a correctional institution (excluding those sentenced to life or indeterminate) was slightly shorter for Aboriginal and Torres Strait Islander defendants compared to non-Indigenous defendants in Queensland and South Australia (8 compared to 9 months; and 4 compared to 7 months respectively). In New South Wales and the Northern Territory there was no difference in the median sentence length for custody in a correctional institution by Indigenous status (12 months and 3 months). (Table 60) Document Selection These documents will be presented in a new window.
|
||
